Payroll Dashboard Setup Guide For Growing Organizations
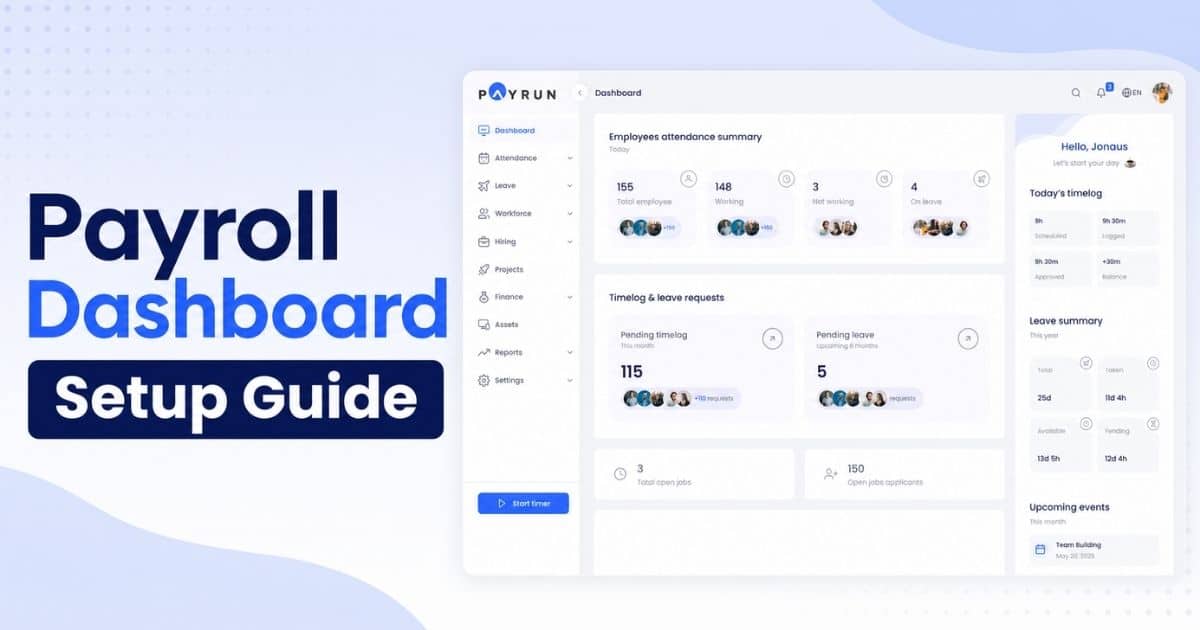
Table of Contents
Organizations scaling from 25 to 250 employees face a common challenge: payroll data lives in too many places. Spreadsheets multiply, reports arrive late, and finance teams spend hours reconciling numbers that should already match. A payroll dashboard solves this by pulling compensation data, tax calculations, and workforce metrics into a single visual workspace. This guide walks through the practical steps to set up a payroll dashboard, choose the right metrics, manage compliance visibility, and integrate with existing HR and finance systems. Whether you are running your first structured payroll reporting project or refining a setup that has outgrown its original design, the sections ahead offer a clear path from planning through rollout.

Payroll Dashboard Overview For Growing Organizations
A payroll dashboard is a real-time, visual workspace that consolidates payroll costs, headcount, and compliance data for HR and finance leaders. Rather than pulling reports from separate systems and pasting them into spreadsheets, a dashboard presents live views of payroll expenses by department, location, and employment type using charts, tiles, and trend lines. Payroll dashboards track costs and productivity in real-time, replacing the lag that comes with monthly static exports.
Growing organizations, particularly those scaling between 2022 and 2026, struggle with fragmented payroll reports. HR uses one tool for employee records, finance uses another for cost posting, and payroll processing sits in a third platform. The result is inconsistent numbers, delayed visibility, and recurring reconciliation work. A multi-country payroll consolidation project in the retail sector demonstrated the scale of improvement possible: centralizing payroll data through integrated dashboards reduced error rates by 63% and cut finance reporting lag from 12 days to 3.
Payroll dashboards track labor costs, analyze pay trends, and ensure compliance across jurisdictions. Dashboards matter most after specific thresholds. When a company passes 50 employees, employment law complexity increases, benefit programs expand, and tax jurisdictions multiply. Adding a second location or supporting remote teams introduces cost differences that are invisible in flat spreadsheets but immediately clear on a well-structured dashboard. The core data domains covered in this guide include gross payroll cost, employer taxes, benefits, overtime, and time tracking feeds.
Key Metrics And Views On A Payroll Dashboard
Deciding what to display on the main screen versus secondary tabs is one of the first design decisions. Overloading the primary view with every possible metric creates noise. The main screen should capture high-impact summary figures, while drill-down tabs handle the detail.
A payroll dashboard can show employee hours and payroll costs on a single view, but the essential metrics to prioritize are:
Metric | What It Captures | Typical Segmentation |
|---|---|---|
Total Payroll Costs Per Month | Salaries, wages, bonuses, overtime, employer taxes, benefits | Company-wide, by location |
Average Payroll Cost Per Employee | Total payroll divided by active employees | Full-time, part-time, contractors |
Overtime Percentage | Overtime pay as share of total payroll | Department, company-wide |
Benefits As Share Of Payroll | Employer contributions (health, retirement, allowances) divided by total cost | Plan type, location |
Employer Tax Burden | Social security, unemployment, statutory contributions by jurisdiction | State, country |
Trend visualizations covering 6 to 12 months help identify payroll inflation, seasonal spikes, or rapid growth in specific teams like engineering or sales. According to a Databox survey of small businesses, the most commonly tracked metrics included employee leave, overtime, payment accuracy, payroll expenses, and hours worked.
The dashboard should allow users to filter by department, cost center, location, and employment type instead of listing raw data with no controls. Supplemental views such as variance from budget, comparison of actual payroll expenses to forecast, and alerts for sudden jumps above a defined percentage threshold round out the reporting. Real-time estimates of tax liabilities are provided by payroll dashboards, giving finance teams early warning of cash flow requirements.
Step By Step Payroll Dashboard Setup
This section walks through a typical setup flow from data connections through validation, focusing on growing organizations implementing a dashboard for the first time. Each subsection addresses a distinct phase of implementation, from connecting sources to rolling out access and training.
Data Sources And System Connections
The foundation of any payroll dashboard is clean, connected data. Source systems commonly include an HRIS for employee master records (job title, department, status, salary), time and attendance tools for hours worked and overtime, the payroll engine for gross and net pay calculations, and accounting software for cost center mapping.
Concrete source categories to connect include employee master data with hire and termination dates, time sheets and leave records, pay rates covering base pay and shift differentials, and chart of accounts used for posting payroll costs. Payroll dashboards integrate with time-tracking tools and HR programs to automate calculations, reducing manual file transfers.
For organizations that need to pull data from multiple platforms, tools like Coupler.io or smart attendance tracking software with real-time timeline views can help connect your data source to the dashboard layer. The critical principle is choosing a single source of truth for each data type. When HR and payroll use different definitions of "active employee," the dashboard will show conflicting values that undermine trust in the entire system.
A recommended approach is to map the data architecture visually, with arrows from HR, time tracking, and general ledger into the payroll dashboard. This diagram becomes a reference document during setup and future troubleshooting.
Metric Definitions And Payroll Cost Logic
A dashboard lets users define what counts as payroll costs: gross wages, overtime premiums, employer social security, health insurance contributions, and bonuses. Documenting metric formulas directly in the dashboard prevents confusion. For example, "Employer Tax Burden = sum of employer social security + unemployment + other statutory contributions divided by total payroll expense."
Regional variation matters significantly. In the United States, employer costs include Social Security tax, Medicare, state unemployment, and workers' compensation. In the United Kingdom, National Insurance contributions and pension auto-enrolment apply. In the Gulf region, components like GOSI or DIFC contributions may factor in. A dashboard configuration should reflect these differences per jurisdiction.
Standardized definitions improve reporting consistency across finance, HR, and operations. When everyone agrees on what "total payroll cost" includes, monthly reviews become faster and disputes over numbers disappear.
Layout Design And Visual Structure
A recommended layout for dashboards starts with a top row of summary tiles displaying total cost, average cost per employee, headcount, and overtime percentage. The middle section holds trend charts showing monthly payroll cost movements and departmental comparisons. The lower area presents detailed tables for payroll expenses by employee type, department, and location.
Visual hierarchy matters. The first screen should prioritize high-level payroll expenses, headcount, and variance metrics before users drill into more granular details. Bar charts work well for departmental cost comparisons, line charts for monthly payroll trends, and heatmaps or color-coded tables for overtime and absenteeism patterns. You can visualize payroll data with a monthly calendar heatmap to surface spending intensity across pay periods. Calendar views in dashboards reveal daily employee work patterns, and clear timelines show current stages of the payroll cycle in payroll dashboards.
Responsive design ensures the dashboard rearranges tiles and charts appropriately for laptop, tablet, and large screen displays in HR offices. A dashboard that only works on one device type will see lower adoption.
User Roles, Permissions, And Data Privacy
Restricting access to sensitive payroll data is not optional. Typical roles in a dashboard include payroll administrator with full access, HR manager who sees employee-level data but not bank or tax identifiers, finance controller focused on cost centres and GL mapping, and department manager who sees only aggregated costs for their team.
Role-based permissions protect sensitive salary data from unauthorized views. A dashboard can mask individual salary figures from line managers while still allowing them to see aggregated payroll costs for their teams. Employee self-service portals empower staff to view paystubs and update direct deposit information, adding another layer of access that needs governance.
Audit trails remain essential. Every adjustment to payroll dashboards, filters, or data definitions should be recorded with user and timestamp details to support both internal controls and external audit requirements.
Validation, Testing, And Reconciliation
Before launching a dashboard to stakeholders, thorough testing is non-negotiable. A practical checklist includes comparing dashboard totals with official pay run reports for two or three historical months, running side-by-side comparisons of dashboard payroll expenses against amounts posted to the general ledger and bank disbursement files, and sampling individual employees to confirm that their gross pay, deductions, and employer costs aggregate correctly.
Automated data validation flags payroll anomalies before processing, catching issues that manual review would miss. Structured payroll audit strategies complement this by ensuring discrepancies, potential overpayments, and validation errors are caught before processing reaches the payment stage. An effective payroll dashboard minimizes manual errors, and over time, payroll dashboards eliminate the risks of manual data entry that plague spreadsheet-dependent organizations.
In one documented case study, a company with approximately 150 employees saw payroll errors drop by 90% after implementing structured validation processes, with processing effort falling from roughly 1.5 FTE to 2 hours per payroll period.
Organizations should schedule quarterly validation reviews, especially after changing compensation structures or benefit plans.
Rollout, Training, And Continuous Improvement
Launch the payroll dashboard in phases. Start with HR and finance leadership as a pilot group, gather feedback on usability and accuracy, then extend access to department heads. This phased approach catches issues before they reach a wider audience.
Training formats that work well include 60-minute online sessions for initial walkthroughs, short video tutorials for specific features, and quick reference guides embedded directly in a dashboard. Feedback loops keep the dashboard relevant: users propose new views like overtime by project or cost per hire, and dashboard administrators refine the layout every quarter.
Payroll dashboards provide statistics on portal adoption rates, which helps measure rollout success. Organizations should also track how often managers log in, how frequently reports are exported, and which filters see the most use. You can track employee hours and payroll costs in real-time once the dashboard is fully operational, turning it from a reporting tool into a daily management resource.
Payroll Cost Visibility And Budget Control
Live payroll dashboards help growing organizations keep payroll costs aligned with approved budgets and hiring plans. Rather than waiting 30 to 60 days for monthly or quarterly summaries from separate systems, finance teams can monitor actual payroll expenses versus budget as transactions post. Payroll dashboards help leaders spot labor cost spikes early, before pay runs finalize and corrections become expensive, particularly when combined with payroll automation software that can adjust calculations quickly.
Finance teams benefit from visuals such as variance bars and traffic light indicators that quickly show whether payroll spending is on track, slightly above plan, or significantly over budget. Tracking payroll costs as a percentage of revenue provides additional context. Typical ranges vary by industry: professional services often see payroll and benefits at 30 to 40% of revenue, technology companies may run higher when R&D is heavy, and retail operations tend toward lower percentages but with high labor management complexity.
A dashboard can highlight departments or locations where payroll costs consistently exceed targets, prompting deeper analysis of overtime, allowances, or unplanned hires and the underlying payroll processing steps that drive those variances.
Department Level Payroll Analysis
Slicing payroll data by department helps leaders understand which teams drive the largest share of payroll expenses. For example, comparing customer support payroll costs across regions reveals whether cost differences stem from headcount, pay rates, or overtime patterns.
Charts that show cost per department alongside headcount make it easy to see whether rising costs come from growth in people or rising cost per employee. A dashboard allows grouping by cost centers or project codes, making it easier to track payroll tied to specific initiatives or clients. Role-based cost analysis helps optimize hiring and budgeting, and payroll dashboards provide visibility into labor costs by role. Role-based cost analysis reveals spending distribution across positions, giving HR and finance a shared view of where compensation investments concentrate.
Headcount And Cost Per Employee Tracking
The dashboard should track active headcount and calculate payroll cost per employee over time. When cost per employee rises faster than headcount, it suggests changes in compensation strategy, a shift toward more senior roles, or increased benefits costs that warrant review.
A line chart for headcount alongside a second line for average payroll expense per employee, sharing the same time axis, provides immediate clarity. A dashboard can support segmentation by employee type, distinguishing salaried staff from hourly workers when analyzing per-employee costs. Payroll dashboards help compare internal pay scales against industry standards, supporting retention and recruitment decisions. You can identify high-cost employees using detailed payroll metrics, and identifying highest-cost employees helps optimize payroll expenses through targeted reviews.
Overtime, Premium Pay, And Labor Efficiency
Overtime hours and overtime pay as a percentage of total payroll costs directly affect profitability. Seasonal patterns are common: hospitality, logistics, and retail businesses see spikes around holidays and sales periods. According to industry benchmarks, sustained overtime above 8 to 10% of total hours often triggers deeper review or staffing adjustments.
A dashboard can flag overtime thresholds, for example, when overtime exceeds a set percentage of regular pay, prompting scheduling or staffing changes. Comparing overtime levels against output metrics like orders fulfilled or tickets resolved helps assess overall labor efficiency. Detailed timesheet breakdowns and employee time log reporting provide visibility into payroll spending at the shift and team level, connecting time data to cost outcomes. Payroll costs can be analyzed by role for strategic planning, revealing whether overtime concentrates in specific positions.
Benefits, Taxes, And Total Payroll Expenses Breakdown
The dashboard should break payroll expenses into salary, variable pay, statutory costs, and employer-funded benefits, mirroring how modern payroll software for startups and growing teams structures compensation data. A stacked bar chart or donut chart where each component is color-coded makes trends visible over time. A dashboard allows filtering benefits costs by plan type, such as health insurance, retirement contributions, and allowances, supporting better plan design decisions.
Tracking employer taxes by jurisdiction is important for organizations with employees in multiple states or countries. This view helps control total payroll tax exposure and prepare for changes in statutory rates.
Forecasting Payroll Costs And Scenario Planning
Live dashboard data serves as a baseline for payroll forecasting, especially when synchronized with core payroll processing software. A simple example: forecasting the impact on payroll expenses when adding a new team of ten employees at a specific average salary, including employer taxes and benefits, shows whether the current budget can absorb the growth.
A dashboard can export current payroll metrics into planning tools or spreadsheets, enabling finance teams to run alternative budget scenarios. Understanding payroll expenses aids in budget allocation decisions, and comparing forecasted payroll costs with actual results through the dashboard helps refine hiring plans and compensation strategies over time, a capability that complements payroll software for startups and growing teams.
Compliance, Audits, And Risk Management
Payroll dashboards reduce compliance risk by making key indicators and deadlines visible to HR and finance teams in one place. Organizations facing frequent audits or operating in multiple jurisdictions benefit from having standardized payroll expense and tax views in one system. A payroll dashboard monitors tax filings, labor law updates, and regulatory deadlines, and when paired with payroll automation software, it replaces scattered calendar reminders and email chains.
Centralizing payroll data reduces the risk of relying on outdated spreadsheets when responding to regulators or external auditors. Automated countdowns for bank submission cut-off times help manage deadlines that carry penalties when missed. Maintaining detailed history in the dashboard means any past payroll run, adjustment, or compliance correction can be reviewed without digging through archived files. Automated tax filing and compliance are features of effective automated payroll software, and when embedded in payroll dashboards they streamline what was once a labor-intensive process.
Payroll Tax Visibility Across Jurisdictions
Dashboards help manage payroll taxes across states, provinces, or countries by grouping tax costs by jurisdiction. For organizations with employees in different US states, varying state income tax rules create complexity that a flat spreadsheet handles poorly. Operating in both EU and non-EU countries with different social contributions adds another layer.
A dashboard can group tax costs by jurisdiction, so organizations see where payroll tax is highest and where compliance requires more frequent review. Payroll dashboards alert for shifting labor laws or tax rate changes, giving teams time to adjust before the changes take effect. Payroll dashboards confirm submitted Form 941s or W-2s, providing a verification layer that reduces the risk of missed filings. The dashboard can also show upcoming tax deadlines and amounts due, helping teams prepare cash flow.
Audit Trails And Historical Payroll Records
Audit trails in a dashboard record who changed which payroll field and when, providing a reliable history for internal or external audits. Dashboards can switch views between current and historical payroll periods, enabling auditors to review any month or pay run back to an agreed retention date.
Historic payroll records are organized and searchable for tax audits, replacing the manual effort of locating paper files or old spreadsheets. Storing historical payroll expenses and headcount trends supports long-term compliance checks and labor inspections. Centralized records reduce the time needed to respond to audit queries, which is particularly valuable for organizations that have grown quickly in recent years.
Exception Monitoring And Alerts
Automatic alerts for unusually high adjustments, negative net pay, or duplicate bank accounts catch problems before they reach employees. A dashboard allows configuration of thresholds so that only material exceptions appear, instead of overwhelming users with minor warnings.
Exception monitoring reduces fraud risk by highlighting inconsistent pay patterns, duplicate employees, or sudden spikes in specific allowances. Consider a scenario where an incorrect bonus entry appears as a large variance on the dashboard before payroll is finalized, giving the team time to correct it rather than processing an overpayment. Payroll dashboards monitor common payroll questions and dispute volume, providing early indicators of systemic issues that need attention.
Access Controls And Sensitive Data Protection
Restrictions for sensitive data, including individual salaries, tax identifiers, and bank details, are a core requirement. A dashboard supports role-based access, ensuring that only authorized payroll staff see full detail while managers see summarized payroll costs for their teams.
Aligning access settings with regulations such as GDPR for EU-based employees or similar privacy frameworks in other regions is necessary. Organizations should protect payroll data through periodic reviews of access rights, removing permissions when roles change and verifying that segmentation remains appropriate as the company grows.
Document Management And Evidence Storage
Linking payroll dashboards with supporting documents like contracts, tax filings, and benefit plan summaries creates a complete audit package. A dashboard can reference or store documentation that explains major payroll changes, such as new collective agreements or revised bonus schemes.
Keeping evidence close to the payroll dashboard makes it easier to justify payroll expenses and decisions during audits or board reviews. Organizations should maintain a clear naming convention and retention policy for payroll-related documents linked to dashboard data.
Operational Use Cases For Payroll Dashboards
The payroll dashboard is a daily and weekly operational tool for HR, finance, and line managers, not just a monthly reporting artifact. Different teams log in for specific reasons: checking upcoming payroll expenses, monitoring overtime, verifying contractor payments, or reviewing headcount changes. Growing organizations use dashboards to coordinate across locations and time zones, especially where centralized payroll teams support distributed staff, and a unified HR management system for growing teams strengthens this coordination. Payroll dashboards can be embedded in routine meetings, from weekly operations check-ins to monthly financial reviews, reinforcing the value of integrated HR software for small and medium businesses.
Monthly Payroll Review Meetings
Finance and HR use payroll dashboards during monthly close meetings to review payroll expenses and resolve issues quickly. A typical agenda walks through total payroll cost, department variances, overtime trends, and upcoming changes in benefits or tax rules. A payroll dashboard's export options let teams share key views as PDFs or images with executives who do not access the system directly. Regular, structured use of the dashboard in meetings strengthens data literacy and reduces reliance on ad hoc spreadsheets.
Manager Level Team Cost Monitoring
Line managers use summarized views of payroll costs for their teams without seeing confidential individual salary data. They monitor overtime, shift differentials, and allowances to stay within budget while maintaining service levels. Payroll dashboards can show key ratios for managers, such as payroll cost per unit produced or per customer served, if the organization tracks relevant performance metrics. Manager-level dashboards encourage proactive discussions about scheduling and staffing with HR.
Contractor And Temporary Workforce Tracking
Dashboards that distinguish between employees and contractors help control external labor spend, which is especially valuable for SaaS and software companies using dedicated HR and payroll software for SaaS businesses. Payroll dashboards can group contractor payments by vendor, project, or location to make it easier to compare internal and external labor costs. Growing organizations increasingly use contingent labor and benefit from a clear view of how contractor costs affect overall payroll expenses. Dashboards can also help identify classification patterns that warrant review, reducing misclassification risk.
Multi-Location And Remote Workforce Views
Payroll dashboards support organizations with employees working across offices, branches, or remote locations. Filter options such as viewing payroll costs by city, state, or country, and comparing them on a per-employee or per-hour basis, reveal differences in overtime levels, benefit uptake, or labor mix between locations. For example, a company that expanded into a new region can use the dashboard to monitor early payroll trends and adjust hiring plans before costs exceed targets.
Collaboration Between HR, Finance, And Operations
A shared payroll dashboard gives HR, finance, and operations leaders a common set of numbers to work from. Payroll dashboards enable each function to view the same payroll data through tailored lenses, minimizing disagreements about which numbers are correct. Having a shared dashboard speeds up decisions on salary reviews, headcount approvals, and scheduling changes, particularly in fast-growing teams. Consider a cross-functional decision like adjusting overtime budgets for a busy quarter: with dashboard evidence showing current spend and trends, the conversation moves from debate to action in minutes, particularly when supported by HR software for small businesses that centralizes related workforce data.
Integration Of Payroll Dashboards With HR And Finance Systems
Integrated dashboards are essential for accuracy, avoiding duplicate data entry, and achieving a real-time view of payroll expenses, especially when connected to comprehensive payroll software with automation features. Many growing organizations already use HR information systems and accounting platforms, and payroll dashboards are most effective when connected to these tools. Integration reduces manual file imports, which are error-prone and delay visibility of payroll costs and taxes. This section covers HR data feeds, accounting connections, time tracking, data governance, and performance considerations, all of which are supported by modern payroll processing software.
HR Data And Employee Master Records
Core employee data such as job title, department, grade, compensation elements, and employment status must flow into the payroll dashboard accurately. Payroll dashboards synchronize with HR systems to update hires, terminations, promotions, and salary changes, which then appear in payroll cost views. Clean, standardized job and department structures in the HR system are critical for accurate payroll reports. Organizations should schedule regular data quality checks to catch discrepancies like missing departments or outdated cost center codes, ensuring hr data remains reliable.
Accounting And General Ledger Connections
Payroll expenses in payroll dashboards map to general ledger accounts so finance teams can reconcile dashboard data with financial statements. Integration with accounting systems allows payroll cost postings to be automated, reducing manual journal entries and associated errors. Finance users can align dashboard categories with financial reporting structures, such as splitting payroll costs between direct and overhead labor. This mapping supports more accurate budgeting and profitability analysis by segment or product line.
Time Tracking, Scheduling, And Absence Data
Feeding actual hours worked, scheduled shifts, and leave data into the payroll dashboard in near real-time is a priority for organizations with hourly or shift-based staff. Payroll dashboards connect to time and attendance systems so employee time log reports capture overtime, shift differentials, and absence patterns that then appear automatically in cost analyses. Aligning time codes and absence categories across systems ensures that payroll expenses and labor metrics are calculated correctly. Combining time tracking vs attendance tracking data helps organizations understand how scheduling decisions affect payroll costs and overall productivity.
Data Governance, Ownership, And Change Management
Clear ownership of data feeding the payroll dashboard prevents confusion. HR typically owns employee profiles, finance owns account mappings, and operations owns time and attendance records. Payroll dashboard administrators can set up change workflows so that significant changes in pay structures or benefits are reviewed before they affect reports.
Version control for key reference data like pay code and benefits plans keeps historical dashboard views interpretable. Organizations should create a simple governance document outlining responsibilities, review schedules, and escalation paths related to payroll reporting.
Performance, Scalability, And Data Refresh Cadence
How often the dashboard should refresh depends on the organization's payroll cycle and operational tempo, as well as the cadence of your payroll automation software. Payroll dashboards support scheduled refreshes around payroll cycles, daily updates from time tracking, and near real-time updates for high-volume environments. You should configure data refresh schedules for your payroll dashboard based on when data transitions from provisional to final.
Growing organizations need to plan for increasing data volumes as headcount and transaction counts rise, verifying that dashboards and underlying automated payroll software remain responsive. Setting expectations with stakeholders about when data is final versus provisional during each pay period prevents misinterpretation and builds trust in the dashboard as a reliable resource.
Payrun Payroll Dashboards For Growing Organizations
Payrun is designed for small and medium-sized businesses in the UK and Ireland, combining HR and payroll features in a unified platform rather than offering a scaled-down version of enterprise software. For organizations graduating from basic spreadsheets, Payrun and its comprehensive payroll software features provide structured, auditable payroll reporting as they scale.
Key capabilities relevant to dashboard setup include real-time payroll visibility, centralized payroll data storage, structured approval workflows, and payroll history with full audit visibility, reflecting Payrun’s role as a trustworthy HR management partner. The Payrun Time module captures hours worked, overtime, and leave requests, integrating with Payrun’s simplified leave management system and feeding directly into payroll calculations that support accurate metrics by department or employment type. For UK businesses, Payrun handles RTI submissions to HMRC, and for Irish organizations, it supports Revenue filing. Automated salary calculations, statutory contributions, and deductions simplify compliance and reduce manual effort.
Payrun's administrative dashboards offer visibility into payroll data and employee information, with reporting by department breakdowns and cost trends. For companies operating across UK and Ireland locations, the app handles multi-location statutory jurisdictions, and dashboards combined with HR, leave, and time workflows allow seeing cost differences between locations or employment types.
FAQs
How Detailed Should A Payroll Dashboard Be For A Company With Fewer Than 50 Employees?
Smaller organizations should focus on a concise set of views: total payroll costs, cost per employee, and simple department splits. Overly complex metrics slow adoption and create maintenance burden that a lean team cannot support. Payroll dashboards allow organizations to start with a lightweight layout and expand later as headcount, locations, and reporting requirements grow. For companies under 50 employees, three to five summary tiles and one or two trend charts are usually sufficient to begin.
How Often Should Payroll Dashboard Data Refresh For Most Organizations?
Many growing organizations refresh high-level payroll dashboards daily or after each payroll run, while time and attendance feeds may update more frequently when monitoring overtime closely. Payroll dashboard administrators should align refresh schedules with payroll cut-off dates so that users know when data is considered final for each pay period. Labeling data as "provisional" or "final" in the dashboard interface prevents stakeholders from making decisions on incomplete numbers.
Which Team Usually Owns Payroll Dashboard Configuration?
Ownership often sits with a joint HR and finance working group. System administrators handle technical configuration, while each function owns its data definitions and reporting requirements. Clear ownership prevents uncontrolled changes that could affect how payroll costs and payroll expenses appear to decision makers. A simple RACI chart covering data entry, validation, report design, and access management keeps responsibilities visible.
How Long Does It Typically Take To Implement A Payroll Dashboard In Payrun?
Timelines vary by size and complexity, but many growing organizations can complete an initial Payrun dashboard setup, including data connections and basic validation, within a few weeks. More advanced configurations, such as multi-jurisdiction analytics or deep cost center reporting, may extend the project. The foundational steps outlined in this article, from data sources through validation and rollout, apply regardless of the platform and help set realistic expectations for the implementation timeline.