HR Metrics To Track: 15 Essential Metrics For Better Decisions
Table of Contents
HR teams collect plenty of workforce data, but more data does not always mean better decisions. The real value comes from choosing the right HR metrics to track and connecting those numbers to business goals.
HR metrics can show whether employees stay, hiring works, labor costs remain under control, and workforce performance moves in the right direction. They also give HR professionals evidence to support decisions instead of relying only on assumptions.
The challenge is deciding which data points deserve attention. A long dashboard can create more noise than clarity. This guide focuses on 15 important HR metrics that provide actionable insights across recruitment, retention, employee engagement, performance, and workforce costs. You will also see how to calculate, compare, and use them to support better business outcomes.

What Are HR Metrics
HR metrics are quantitative measures used to assess workforce conditions and the effectiveness of human resource practices. They turn HR data about hiring, retention, attendance, performance, compensation, and employees into measurable information that HR professionals can compare over time.
Good human resource metrics do more than describe what happened. They help HR teams identify workforce trends, evaluate HR efforts, and connect people data with business performance. For example, a rising employee turnover rate may lead HR leaders to examine employee satisfaction, compensation, management, or career opportunities.
The most important HR metrics should ultimately support business objectives. When HR analytics connects workforce metrics with strategic objectives, HR departments can turn raw data into actionable insights and make more informed, data-driven decisions.
15 Essential HR Metrics To Track
The right HR metrics help you see what is happening across your workforce and decide what to do next. The following 15 HR metrics to track cover retention, recruitment, attendance, employee engagement, performance, costs, development, and workforce growth.
HR Metric | Formula | What It Measures | |
|---|---|---|---|
1 | Employee Turnover Rate | Departures ÷ Employees at period start × 100 | Employee exits |
2 | Employee Retention Rate | Original employees remaining ÷ Employees at period start × 100 | Workforce stability |
3 | Absenteeism Rate | Unplanned absent days ÷ Scheduled workdays × 100 | Unplanned absence |
4 | Time To Hire | Offer acceptance date − Application date | Hiring speed |
5 | Cost Per Hire | Total recruiting costs ÷ Total hires | Hiring cost |
6 | Quality Of Hire | Combined performance, retention, and other selected measures | New-hire value |
7 | Offer Acceptance Rate | Accepted offers ÷ Total offers × 100 | Offer competitiveness |
8 | Employee Engagement Score | Survey-based calculation | Employee connection |
9 | Revenue Per Employee | Revenue ÷ Average number of employees | Workforce efficiency |
10 | Overtime Rate | Overtime hours ÷ Total work hours × 100 | Extra labor demand |
11 | Labor Cost Per Employee | Total labor costs ÷ Average employees | Workforce cost |
12 | Training Completion Rate | Employees completing training ÷ Assigned employees × 100 | Training participation |
13 | Internal Mobility Rate | Internal moves ÷ Average employees × 100 | Internal talent movement |
14 | Average Employee Tenure | Total employee tenure ÷ Number of employees | Workforce experience |
15 | Headcount Growth Rate | Net headcount change ÷ Starting headcount × 100 | Workforce growth |
1. Employee Turnover Rate
What it measures: Employee turnover rate shows the percentage of employees who leave during a specific period. Departures can include voluntary turnover, such as resignations, and involuntary exits.
Formula: (Terminations during period ÷ Employees at period start) × 100
High turnover can point to problems with management, compensation, employee satisfaction, workload, or career growth. HR teams should also separate voluntary and involuntary turnover to understand the cause. Compare turnover trends by department, manager, role, and tenure instead of relying only on one company-wide rate.
What to check next: Retention rate, engagement metrics, absenteeism, and exit data.
2. Employee Retention Rate
What it measures: Retention rate shows how many employees from the start of a set period remain with the organization at the end. Strong retention can support continuity, institutional knowledge, and a more productive workforce.
Formula: ((Employees at end − New hires) ÷ Employees at start) × 100
For example, if 100 employees started the year and 90 of that original group remained, retention is 90%. A decline deserves investigation, but industry benchmarks should provide context rather than become automatic targets. Compare retention data across business units, managers, roles, and employee tenure.
What to check next: Turnover rate, employee satisfaction, internal mobility, and compensation data.
3. Absenteeism Rate
What it measures: Absenteeism measures how much scheduled work time employees miss because of unplanned absences. It can reveal workforce trends that attendance totals alone may hide.
Formula: (Unplanned absent days ÷ Total scheduled workdays) × 100
High absenteeism can create lost productivity, increase workloads for other employees, and disrupt operations. A rising rate can also signal low morale, disengagement, stress, burnout, or other workplace concerns. Tools like smart attendance tracking software can help HR professionals spot these patterns earlier. Avoid judging employees from one data point. HR professionals should look for patterns by team, role, location, and specific period before drawing conclusions.
What to check next: Overtime, employee engagement, turnover, and workload data.
4. Time To Hire
What it measures: Time to hire measures the number of days between a candidate entering the recruitment process and accepting an offer. It shows how quickly the hiring process moves once a candidate becomes active.
Formula: Offer acceptance date − Candidate application/entry date
Long hiring cycles can increase the risk of candidate dropouts and leave positions vacant for longer. Do not confuse time to hire with time to fill, which usually starts when a requisition or vacancy opens. SHRM's 2025 research reports time to fill at roughly six weeks, showing why HR teams should define the metric consistently before comparing results.
What to check next: Candidate drop-off, offer acceptance, quality of hire, and recruitment source.
5. Cost Per Hire
What it measures: Cost per hire indicates how much your organization spends to add each new employee. It combines relevant internal and external recruiting costs.
Formula: (Internal recruiting costs + External recruiting costs) ÷ Total hires
Costs may include recruiter labor, job advertising, agency fees, assessments, technology, and other recruitment expenses. Current SHRM benchmarking puts average nonexecutive cost per hire at $5,475 and executive cost per hire at $35,879, showing why one universal $8,000 benchmark can be misleading. Compare similar roles and historical data instead.
What to check next: Time to hire, source of hire, quality of hire, and early turnover.
6. Quality Of Hire
What it measures: Quality of hire estimates the value a new employee brings after joining. HR departments often combine employee performance, retention, goal achievement, and manager feedback because no single formula works for every business.
Formula example: (Performance score + Retention score + Manager satisfaction score) ÷ Number of measures
Quality matters because a fast and cheap recruitment process means little when new hires perform poorly or leave early. SHRM reports that only 20% of organizations measure quality of hire, despite its value for recruitment strategies. Connect the metric to first-year performance and retention.
What to check next: First-year turnover, performance ratings, time to productivity, and hiring source.
7. Offer Acceptance Rate
What it measures: Offer acceptance rate reveals the percentage of job offers that candidates accept. It provides a simple signal of how competitive and effective the final stage of your recruitment process is.
Formula: (Accepted job offers ÷ Total job offers made) × 100
A falling rate may point to compensation, benefits, candidate experience, slow decisions, job expectations, or stronger competing offers. Avoid treating the number as proof of one problem. Segment the HR data by role, location, hiring manager, and recruiting source. Compare results with time to hire and candidate feedback before changing recruitment strategies.
What to check next: Time to hire, compensation, candidate feedback, and offer declines.
8. Employee Engagement Score
What it measures: Employee engagement metrics reflects how connected, motivated, and committed employees feel at work. HR teams can use pulse surveys, engagement surveys, and employee Net Promoter Score to collect people data.
eNPS formula: % Promoters − % Detractors
A survey score alone cannot explain why engagement changes. Compare it with absenteeism, voluntary turnover, employee satisfaction, and performance. Lower engagement alongside rising absences or turnover creates a stronger warning signal than any metric viewed alone. HR leaders should also segment engagement results across business units and managers to find where employee experiences differ.
What to check next: Absenteeism, voluntary turnover, satisfaction, and employee performance.
9. Revenue Per Employee
What it measures: Revenue per employee compares company revenue with workforce size. It provides a high-level view of how efficiently the organization turns its human resources into business outcomes.
Formula: Total revenue ÷ Average number of employees
A rising number may reflect stronger productivity, automation, pricing, or business growth. A falling number does not automatically mean employees perform poorly. Changes in business strategy, workforce transformation, market conditions, or major hiring can move the metric too. Compare historical data and similar business units before reaching conclusions. Revenue per employee works best alongside other workforce metrics rather than alone.
What to check next: Headcount growth, labor costs, overtime, and employee performance.
10. Overtime Rate
What it measures: Overtime rate indicates how much employee work happens beyond regular scheduled hours. It helps HR professionals understand staffing pressure, workload distribution, and extra labor demand.
Formula: (Overtime hours ÷ Total hours worked) × 100
Some overtime is normal. A steady increase deserves attention. Persistent overtime can indicate understaffing or uneven workloads and may contribute to higher labor costs and employee burnout. AIHR also notes that regular overtime can signal insufficient staffing and can contribute to turnover. Compare overtime with absenteeism and headcount before deciding whether additional hiring is necessary.
What to check next: Absenteeism, turnover, headcount, and labor cost per employee.
11. Labor Cost Per Employee
What it measures: Labor cost per employee reveals the average workforce cost associated with each employee. Depending on the business objective, total cost can include wages, employer taxes, benefits, bonuses, overtime, and other employee-related expenses.
Formula: Total labor costs ÷ Average number of employees
The metric gives HR leaders and finance teams a clearer way to connect workforce data with business performance. A rising result is not automatically negative. Higher compensation may support retention or reflect a shift toward specialized roles. Compare labor costs with revenue per employee, retention data, and workforce growth to understand the business impact.
What to check next: Revenue per employee, overtime, retention, and compensation trends.
12. Training Completion Rate
What it measures: Training completion rate reflects how many assigned employees finish a learning or development program. It provides a basic view of participation across talent management and employee development efforts.
Formula: (Employees completing training ÷ Employees assigned training) × 100
Completion does not prove that training worked. HR metrics important to development should also examine what happens afterward. Compare training participation with goal achievement, employee performance, internal mobility, and relevant business outcomes. Training ROI can go further by comparing training expenses with measurable performance improvements. That distinction keeps HR teams from treating course completion as the final measure of success.
What to check next: Performance improvement, goal achievement, training ROI, and internal mobility.
13. Internal Mobility Rate
What it measures: Internal mobility rate shows how often employees move into new positions, promotions, or other opportunities inside the organization. It helps measure how effectively a company uses existing talent.
Formula: (Internal moves during period ÷ Average number of employees) × 100
A healthy internal talent pipeline can reduce dependence on external recruiting and create visible career paths for employees. SHRM recommends considering how many positions are filled by internal versus external candidates when evaluating recruitment effectiveness. Segment internal mobility by department, role, and employee group to uncover opportunities or barriers.
What to check next: Retention rate, promotions, external hiring, and employee tenure.
14. Average Employee Tenure
What it measures: Average employee tenure shows how long employees typically stay with the organization. It provides useful workforce intelligence about stability, experience, and retention over time.
Formula: Combined employee tenure ÷ Number of employees
A tenured employee may hold valuable company, customer, and process knowledge, but a high average is not automatically better. Very low tenure may signal early turnover, while very high tenure combined with weak internal mobility could point to limited workforce movement. Break the metric down by role and department. New-hire retention deserves special attention because early turnover can expose problems with recruitment, expectations, onboarding, or management.
What to check next: Early turnover, retention, internal mobility, and employee satisfaction.
15. Headcount Growth Rate
What it measures: Headcount growth rate tracks how quickly the number of employees changes over a set period. It helps connect workforce planning with future business goals and strategic objectives.
Formula: ((Ending headcount − Starting headcount) ÷ Starting headcount) × 100
Fast growth can support expansion, but headcount alone says little about workforce health. HR teams should compare growth with turnover, hiring costs, revenue per employee, and employee performance. A company that adds many employees while turnover also rises may have a different problem than a company expanding because demand increased. Use multiple metrics to turn headcount data into strategic insights.
What to check next: Turnover, cost per hire, revenue per employee, and workforce demand.
How To Choose The Right HR Metrics To Track
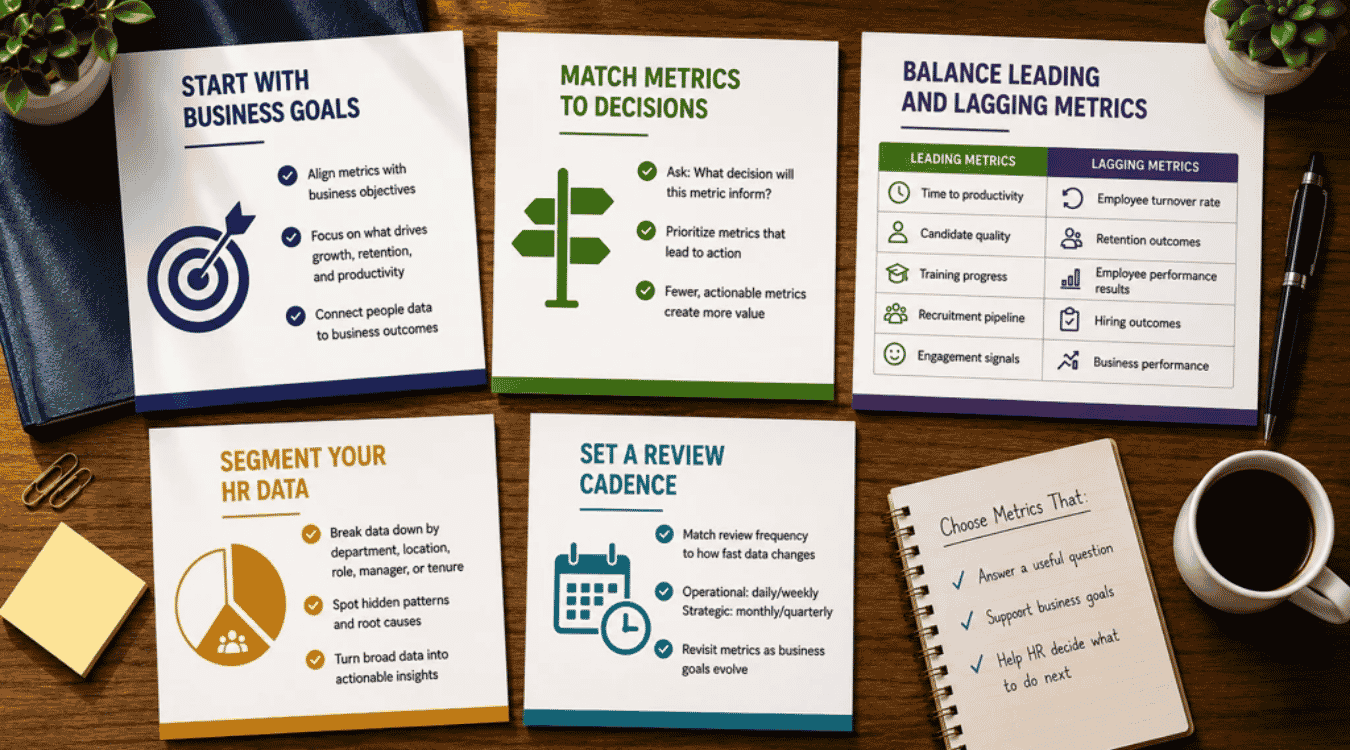
Not every number deserves a place in your HR reports. The right HR metrics to track should answer a useful question, support business goals, and help HR teams decide what to do next. Start small, then add metrics when they provide real value.
Start With Business Goals
Start with what the business wants to achieve. A company focused on growth may care about time to hire, quality of hire, and headcount. A company struggling to keep top talent may focus on employee turnover rate, retention rate, employee engagement, and internal mobility rate.
HR leaders should connect workforce metrics to business objectives instead of tracking data because it is available. Modern HR management systems can help centralize these metrics and link traditional HR measures, such as headcount and turnover, to broader business outcomes. That connection helps HR professionals show how their work supports business strategy and business performance.
Match Metrics To Decisions
Ask a simple question before adding a metric: What decision will we make with this information? If no clear answer exists, the metric may not deserve priority.
For example, cost per hire can help HR teams compare recruitment strategies and control recruiting costs. Turnover data can help them decide where retention efforts need attention. An HR software feature set for small businesses that covers recruitment, onboarding, attendance, and payroll can make these metrics easier to capture and act on. HR analytics should move beyond reporting what happened and help explain why it happened and what to do next. A smaller set of actionable data points often provides more valuable insights than a dashboard packed with human resource metrics that nobody uses.
Balance Leading And Lagging Metrics
Use both leading and lagging indicators to understand workforce trends. Leading metrics can provide an early signal of what may happen. Lagging metrics show an outcome that has already occurred.
For example, time to productivity can provide an early view of how well new hires adapt. Employee turnover rate shows employees who have already left. Changes in employee engagement, absenteeism, or hiring activity may also provide useful context before larger workforce problems become clear. SHRM recommends using both types of indicators to understand HR's impact more fully.
Leading Metrics | Lagging Metrics |
|---|---|
Time to productivity | Employee turnover rate |
Candidate quality | Retention outcomes |
Training progress | Employee performance results |
Recruitment pipeline | Hiring outcomes |
Engagement signals | Business performance |
Segment Your HR Data
A company-wide average can hide an important problem. A 10% turnover rate may look manageable until you find that one business unit has a much higher rate than the rest.
Break workforce data down by department, location, role, manager, employment type, or employee tenure when appropriate. The same approach can improve analysis of retention data, cost per hire, employee satisfaction, absenteeism, and performance, especially when supported by robust employee attendance tracking and related time data. SHRM notes that an initial metric should often lead HR professionals to investigate where and why a problem occurs. Segmentation turns broad people data into more actionable insights.
Set A Review Cadence
HR metrics do not all need the same review schedule. Match the cadence to how quickly the data changes and how soon someone can act on it.
Operational data may need frequent attention. Recruitment pipeline data can require daily or weekly reviews, while turnover trends, hiring costs, quality, and workforce planning often make more sense monthly or quarterly. Real-time reporting within workforce management software can support these different cadences. AIHR recommends matching review frequency to the action required. HR teams should also revisit their chosen metrics as business goals change. A metric that matters today may become less useful as the company and its strategic objectives evolve.
Metric Type | Suggested Cadence | Examples |
|---|---|---|
Operational | Daily or weekly | Attendance, recruitment pipeline |
Hiring | Weekly or monthly | Time to hire, offer acceptance |
Workforce | Monthly | Headcount, overtime, absenteeism |
Strategic | Monthly or quarterly | Turnover, retention, revenue per employee |
Development | Quarterly | Training, internal mobility, employee performance |
How To Turn HR Metrics Into Better Decisions
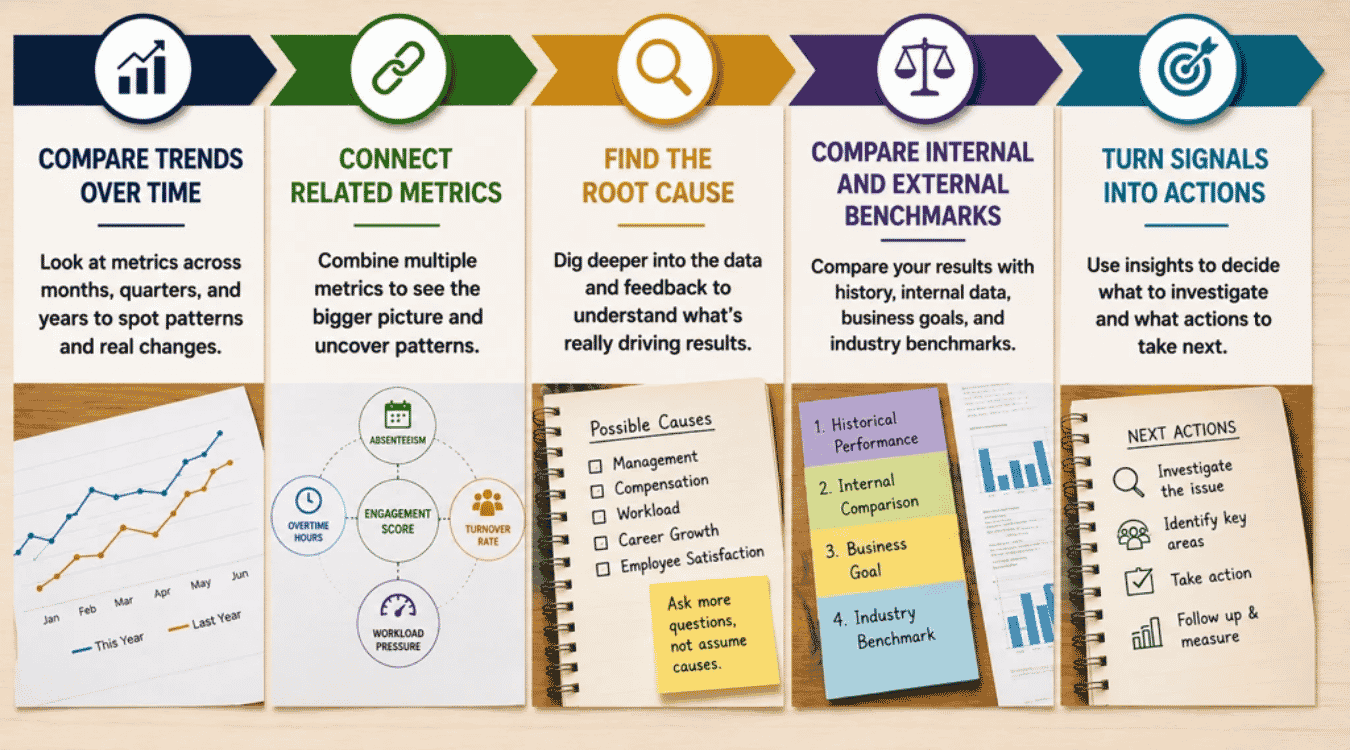
HR metrics become useful when they lead to action. A turnover rate or engagement score alone tells only part of the story. HR teams need to compare trends, connect related data points, find possible causes, and decide what needs attention next. Modern personnel management software can support this by centralizing data and surfacing trends automatically.
Compare Trends Over Time
One HR metric from one month gives you a snapshot. Historical data gives you context. Compare workforce metrics month over month, quarter over quarter, and year over year to see whether a change is temporary or part of a larger pattern.
Suppose employee turnover rate moves from 8% to 9%. That change may not mean much alone. A steady rise from 5% to 9% over four quarters tells a different story. HR professionals can then segment turnover trends by department, role, or tenure using innovative HR analytics features that visualize these shifts. Trend analysis turns basic HR data into more useful workforce intelligence and helps HR leaders spot problems earlier.
Connect Related Metrics
Avoid reading HR metrics in isolation. Multiple metrics often tell a clearer story when you put them together, particularly for distributed teams where HRM software for managing a remote workforce can unify communication, attendance, and performance data. CIPD recommends connecting people data with business data so leaders can make better decisions and solve business problems.
For example, rising absenteeism plus higher overtime and falling employee engagement may point to workload pressure. High early turnover alongside a long time to productivity may suggest problems with the recruitment process or onboarding. A rising cost per hire becomes more meaningful when you compare it with quality of hire and retention data. Connected HR analytics can reveal patterns that a single metric may miss.
Find The Root Cause
A metric tells you what changed. It does not always tell you why. HR teams should treat unusual results as a reason to ask more questions, not as proof of a cause.
High employee turnover may relate to management, compensation, workload, employee satisfaction, or limited career growth. High absenteeism can also have several causes. Compare the original signal with engagement metrics, manager data, exit feedback, performance, and other relevant people data. CIPD also cautions that correlation and causation are different concepts in people analytics. HR professionals need enough evidence before choosing an HR strategy.
Compare Internal And External Benchmarks
Industry benchmarks can tell you how your results compare with other organizations, but they should not become automatic targets. Company size, location, industry, workforce structure, and business strategy can all affect what a healthy result looks like.
Start with your own historical data. Compare the current result with previous periods, business units, and strategic objectives. Then add relevant external benchmarks for context. CIPD recommends external benchmarking because market comparisons can make workforce data more meaningful for business leaders.
Use a simple order: historical performance → internal comparison → business goal → industry benchmark.
Turn Signals Into Actions
The final step is the most important. Every critical HR metric should help someone decide what to investigate or do next. HR analytics creates more value when people data solves a business problem rather than simply fills a report. SHRM reports that retention and turnover are among the most common uses of people analytics.
Use each signal to choose the next data point, possible cause, and action. For example, high turnover can trigger a review of retention data, managers, compensation, and exit feedback. Low offer acceptance can lead to a review of pay, hiring speed, and candidate feedback. That process turns workforce data into actionable insights and supports data-driven decisions.
HR Signal | Check Next | Possible Cause | Possible HR Action |
|---|---|---|---|
High turnover | Engagement, tenure, exit data | Management or retention issue | Review patterns by team and manager |
High absenteeism | Overtime, engagement, workload | Workload or morale issue | Review staffing and workload |
High cost per hire | Hiring source, time to hire | Inefficient recruitment channel | Compare recruitment strategies |
Low offer acceptance | Pay, hiring speed, feedback | Weak offer or slow process | Review offers and hiring process |
Low productivity | Absence, overtime, engagement | Capacity or workforce issue | Review staffing and employee support |
Common HR Metrics Mistakes To Avoid
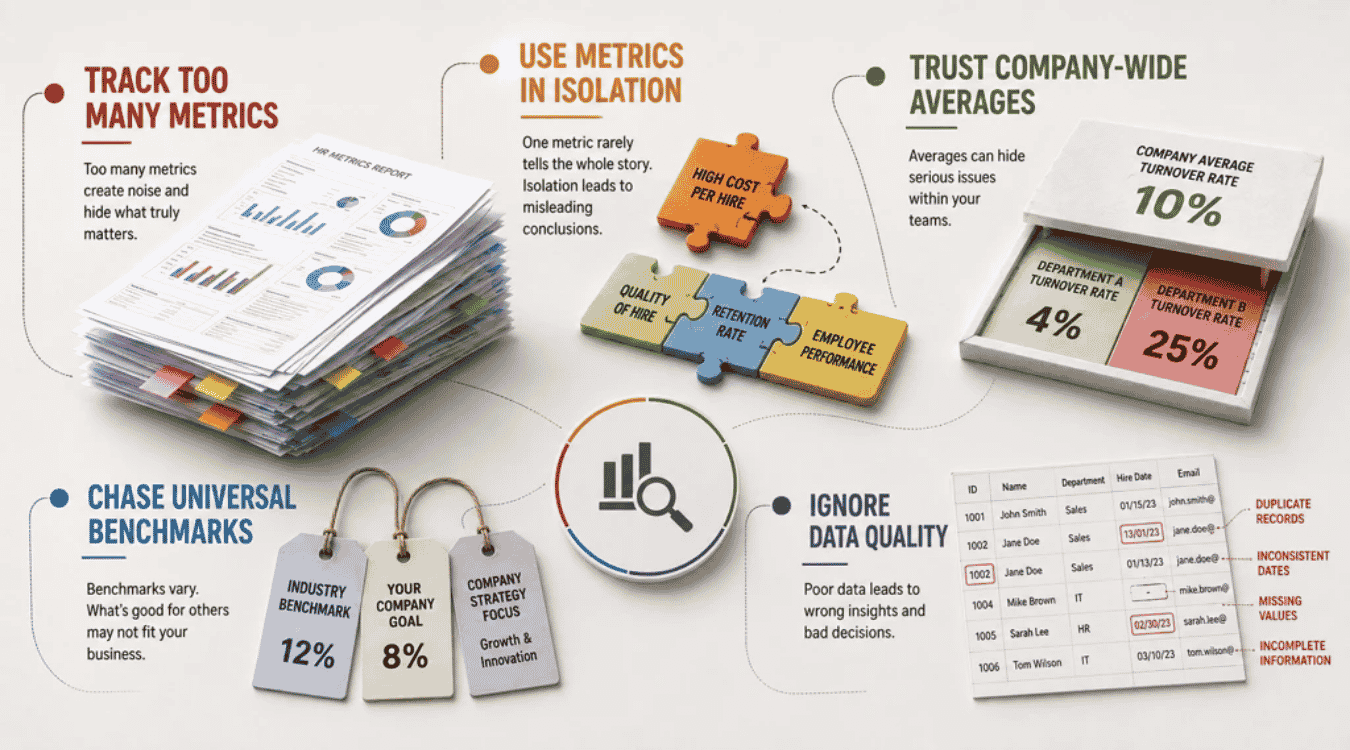
HR metrics can support better decisions, but only when the data has context and a clear purpose. Poor metric choices can create noise, hide workforce problems, and even lead HR teams toward the wrong action. Watch for these five common mistakes.
Track Too Many Metrics
More HR data does not automatically create more valuable insights. A dashboard packed with dozens of workforce metrics can make it harder to see what actually matters. SHRM guidance suggests keeping dashboards focused on metrics tied to business and talent strategy, with the appropriate number depending on the audience.
Choose important HR metrics that connect directly to business objectives. A company focused on retention may prioritize employee turnover rate, retention rate, employee engagement, and internal mobility rate. Another focused on recruitment may need time to hire, cost per hire, and quality of hire. The right metrics should support decisions, not simply fill reports.
Use Metrics In Isolation
One metric rarely tells the whole story. A high cost per hire might look bad until you find that those new hires perform better and stay longer. A low turnover rate might look positive while employee satisfaction and internal mobility continue to fall.
SHRM recommends looking at HR metrics holistically and connecting workforce measures with other data. Combine multiple metrics that describe the same business problem. Pair recruitment costs with quality of hire. Compare employee engagement with absenteeism and voluntary turnover. Connected data points give HR professionals better context and help turn basic reporting into actionable insights.
Trust Company-Wide Averages
Company-wide averages can make a serious workforce issue look normal. Suppose the overall employee turnover rate is 10%. One department could have 4% turnover while another reaches 25%. The company average hides that difference.
Break HR data down by relevant business units, departments, roles, locations, tenure, or managers. Segmentation can also improve analysis of employee performance, absenteeism, retention data, and recruitment outcomes. People analytics works best when HR teams look beyond headline numbers and examine what happens within different employee groups. The goal is to find where a problem exists before deciding how to address it.
Chase Universal Benchmarks
Industry benchmarks provide context, but they do not automatically define good performance. Workforce structure, company size, location, business strategy, and industry can all change what a useful target looks like.
SHRM warns against treating benchmark averages as targets. A benchmark should start a conversation about performance rather than tell every company what result it must achieve. Compare current results with historical data, similar internal groups, strategic objectives, and then relevant external benchmarks. That approach helps HR leaders understand whether a difference actually matters for their business instead of chasing someone else's average.
Ignore Data Quality
Even advanced HR analytics cannot fix unreliable data. Missing employee records, inconsistent definitions, duplicate entries, incorrect dates, or disconnected HR systems can distort results and lead to poor data-driven decisions.
SHRM identifies incomplete, inaccurate, inconsistent, and siloed information as major barriers to effective people analytics. Keep definitions consistent across HR departments and systems. Check how data is collected, who owns it, and whether the same calculation is used across each specific period. Clean workforce data gives HR professionals a stronger foundation for workforce intelligence, strategic insights, and decisions that support business outcomes.
How To Build A Simple HR Metrics Process
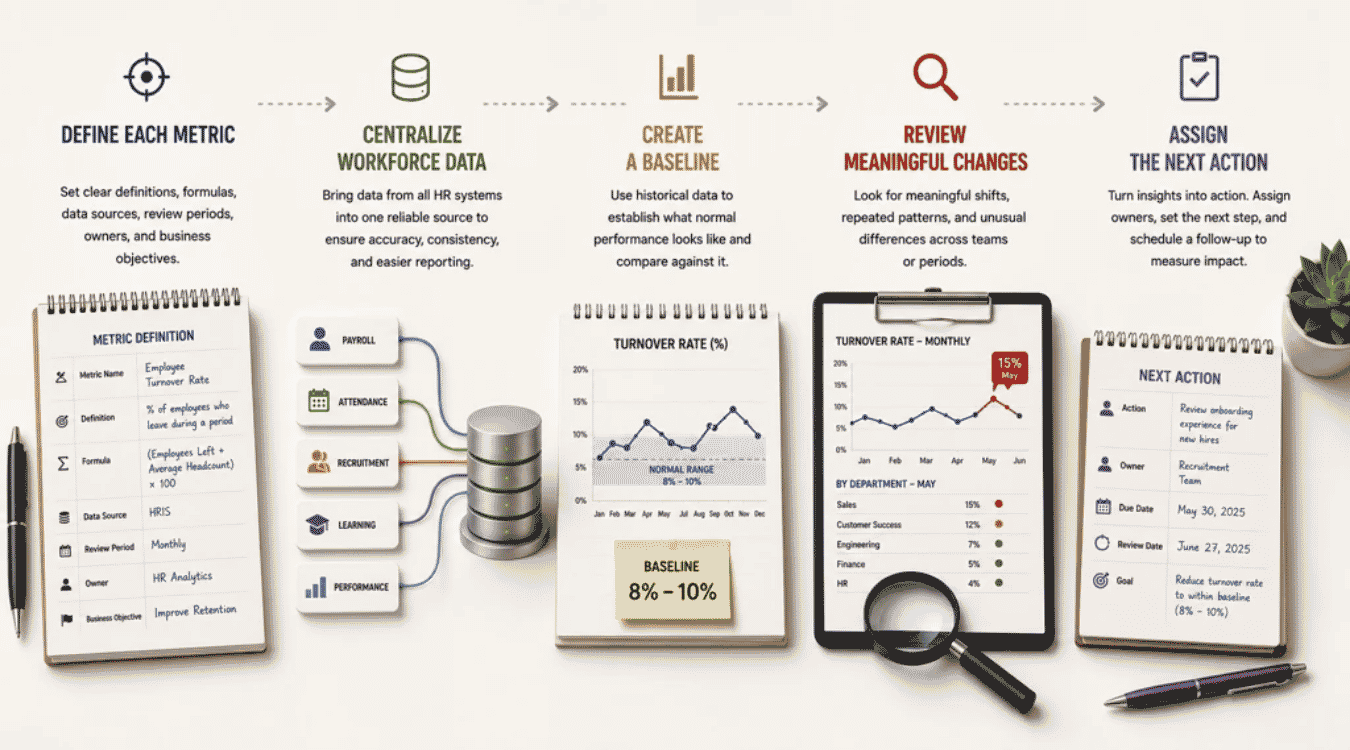
A useful HR metrics process does not need to be complicated. HR teams need clear definitions, reliable workforce data, and a consistent review process. A simple system makes it easier to spot changes and turn HR data into actionable insights.
Define Each Metric
Start by defining exactly what each HR metric means and why you track it. Record the formula, data source, review period, owner, and business objective. Keep the same definition across HR departments and business units.
For example, everyone should calculate employee turnover rate using the same method and specific period. SHRM recommends standardized definitions because inconsistent calculations can weaken workforce intelligence. Clear definitions also make historical data easier to compare. HR professionals can then spend less time debating numbers and more time using them to support business outcomes.
Centralize Workforce Data
HR data often sits across payroll, attendance, recruitment, learning, and other HR systems. Separate sources make collecting data harder and can create conflicting numbers, which is why integrated HR and payroll software is increasingly important.
Bring relevant people data into one reliable reporting process or HR software system where possible. Modern employee record management systems help centralize and secure core employee data as part of that foundation. SHRM recommends consolidating data from systems such as HRIS, applicant tracking, and learning platforms to build a stronger data foundation. A centralized source makes it easier to compare employee performance, retention data, cost per hire, absenteeism, and other important HR metrics without rebuilding reports every time.
Create A Baseline
A number needs context before it becomes useful. Create a baseline from historical data so you know what normal performance looks like for your organization.
Suppose your turnover rate has stayed between 8% and 10% for two years. A jump to 15% deserves more attention than a small monthly change. The same principle applies to employee engagement, absenteeism, revenue per employee, and recruitment metrics. CIPD notes that descriptive analytics can track critical metrics over time. Compare your baseline with business goals and relevant industry benchmarks before setting targets.
Review Meaningful Changes
Do not react every time a metric moves slightly. Look for meaningful changes, repeated patterns, and unusual differences across teams or periods.
A higher cost per hire for one month may come from a few specialized roles. A steady rise alongside longer hiring times and higher external recruiting costs tells a stronger story. HR analytics becomes more useful when multiple metrics work together. An integrated employee management system that centralizes attendance, leave, payroll, and performance data can make these combinations easier to analyze. SHRM specifically notes that combining different data points can produce deeper insights and stronger business outcomes. Focus reviews on changes that could affect employees, HR strategies, or business performance.
Assign The Next Action
Every important finding should end with a clear next step. Decide who owns the issue, what needs to happen, and when the team will review the result again.
For example, rising early turnover may lead the recruitment team to review new hires, onboarding, job expectations, and hiring sources. Higher absenteeism may require HR leaders to examine workload and employee engagement. Implementing employee performance review software can also provide structured data on goals and feedback to evaluate whether actions improve outcomes. CIPD's people analytics process recommends reporting solutions and then evaluating their impact. That feedback loop turns human resource metrics into data-driven decisions instead of another report nobody acts on.
Metric | Current Result | Previous Result | Target | Change | Owner | Next Action |
|---|---|---|---|---|---|---|
Turnover Rate | 12% | 9% | 8% | +3 pts | HR | Review exits by team |
Time To Hire | 38 days | 32 days | 30 days | +6 days | Recruitment | Find hiring delays |
Absenteeism | 4.2% | 3.1% | 3% | +1.1 pts | HR | Review team patterns |
Internal Mobility | 7% | 5% | 8% | +2 pts | Talent | Review internal candidates |
How Payrun Helps Track Workforce Data
Payrun brings employee records, attendance, leave, payroll, hiring, and time data into one all-in-one HR software platform. HR professionals can access workforce data without collecting data from separate spreadsheets and disconnected HR systems. A shared source also gives HR teams a clearer view of workforce trends and reduces repeated manual work.
Payrun also provides dashboards and workforce activity insights that help HR leaders monitor attendance, leave usage, labor costs, and workforce changes. This comprehensive web-based HR management system connects people data, making it easier to identify useful patterns and turn data points into strategic insights. HR departments can use that workforce intelligence to support workforce planning, improve HR strategies, and make data-driven decisions that align HR efforts with business goals and future workforce needs.